
The “XRP 2016 Pattern” cited by EGRAG Crypto is essentially a monthly-chart historical analogy: during XRP’s long accumulation phase from December 2015 to February 2016, XRP printed three consecutive positive monthly candles. From July to September 2026, XRP again closed higher for three straight months. That is why EGRAG raised the question: “2016 → 2026, 50x? $50? Is history rhyming?”
That observation is not completely pulled out of thin air, but it is far from proof that XRP is about to copy the 2017 melt-up. After the three consecutive green monthly candles in 2016, XRP did not immediately take off. It went through a prolonged period of consolidation. The real large-scale price expansion did not arrive until 2017. More importantly, XRP’s market cap in 2016 was tiny. As of October 12, 2026, XRP has a circulating supply of about 63.13 billion tokens and a market cap of roughly $89.3 billion. The same percentage gain would require a completely different scale of capital.
So the right question when studying the EGRAG Crypto XRP 2016 Pattern is not “Will XRP immediately hit $50?” It is: **What exactly has the 2026 monthly structure copied, what has it not copied, how are the $23 and $50 targets calculated, and what conditions would need to be met for XRP to get anywhere near those levels?**
Investors can start by checking XRP live market data to confirm the current price, volume, and monthly-chart position before interpreting the historical analogy. Prices and market data change continuously, so this article’s data snapshot should not be treated as a substitute for live quotes.
Risk disclaimer: This article’s data is updated as of October 12, 2026, and is intended only for market research and investment education. It is not investment advice. EGRAG Crypto is a third-party market commentator and does not represent Ripple, XRPL, or any regulator. Both $23 and $50 are conditional technical scenarios, not price promises.
8 Things to Know Before Studying the XRP 2016 Pattern
- EGRAG is discussing monthly-chart structure, not intraday or short-term trading signals.
- From December 2015 to February 2016, XRP rose for three consecutive months.
- From July to September 2026, XRP again formed three positive monthly candles.
- Historically, the three consecutive green months did not lead to an immediate 50x move.
- $50 mainly comes from historical percentage gains and cycle symmetry, not from fundamental valuation.
- $23 comes from a separate long-term Fibonacci 2.236 extension model.
- Based on the current circulating supply, $23 implies a market cap of about $1.45 trillion, while $50 implies about $3.16 trillion.
- The most important things to verify are spot demand, XRP/BTC relative strength, derivatives leverage, the BTC cycle, and long-term structure—not simply three green monthly candles.
1. Who Is EGRAG Crypto? Does His View Represent Ripple?
EGRAG Crypto is a market commentator in the crypto technical analysis community who has long published XRP charts, cycle analysis, Fibonacci work, and price structure analysis. He is not an official Ripple analyst, and there is no evidence that he has access to Ripple insider information.
That distinction matters. EGRAG’s views are third-party technical analysis. Their value lies in offering a market hypothesis that can be debated, not in providing an official roadmap or a guaranteed target.
On September 21, 2026, EGRAG posted on the original X post: “2016 → 2026… 50X? $50? Is history rhyming?” He emphasized that he was observing a chart pattern, not inventing a historical pattern. Benzinga later reported that XRP had already completed two positive monthly candles at the time, and that September would need to close higher to form a three-month streak similar to 2016.
So the original view itself included question marks and conditions. It was not “EGRAG confirms XRP is definitely going to $50.” When secondary coverage rewrites it as a certainty, it loses the most important context.
2. What Exactly Is the So-Called XRP 2016 Pattern?
What EGRAG focuses on is not a single sudden daily candle, but a monthly candle sequence inside a long-term accumulation area.
Public historical data and EGRAG’s charts show:
- December 2015: XRP rose about 43.6% for the month;
- January 2016: up about 6.1%;
- February 2016: up about 23.8%.
Three consecutive positive monthly closes formed what he calls the “three green monthly candles.” This sequence occurred when XRP was still depressed, with relatively low market attention, so it was interpreted as part of a potential accumulation structure.
But “three consecutive green monthly candles” is only a description of price outcomes: three months in a row where the close was higher than the open. By itself, it does not prove whale accumulation, institutional entry, network usage growth, or a supply shock. It certainly does not automatically predict the next leg of gains.
3. Did XRP Immediately Surge After the 2016 Three-Month Streak?
No. This is the single most important point for understanding the entire historical analogy.
After the third positive monthly candle in February 2016, XRP did not immediately enter a straight-line bull market. It still experienced up months, down months, retests, and long sideways periods. From October 2016 to February 2017, XRP even fell for five consecutive months. Public reviews show that the drawdown during that period was significant, and only in March 2017 did a powerful expansion begin.
So the historical sequence was not:
Three green months → immediate 50x.
It was closer to:
Three green months → repeated consolidation and drawdowns → long-term structure held → market environment changed → 2017 price expansion.
Even if the 2026 analogy ultimately proves valid, it does not mean the rally must happen immediately. Three green monthly candles are, at best, a structural feature that still needs further verification—not an instant buy signal.
4. What Actually Happened in 2017?
The market keeps discussing 2016 not because XRP itself gained that much in 2016, but because it later entered an extreme move in 2017.
Public historical returns show that XRP posted very significant monthly gains in March, April, and May 2017. March rose about 284%, April about 143%, and May about 374%. That performance makes the 2016 bottom structure look extremely attractive in hindsight.
But this also creates hindsight bias. Once we know the 2017 surge happened, it becomes easy to look back and find features such as three green monthly candles, moving averages, triangles, or Fibonacci patterns that appear predictive. The more rigorous question should be: When this structure has appeared at other times and in other assets, what was its success rate?
Without a sufficient sample, the 2016 Pattern is better treated as a scenario analogy than a statistical rule.
5. What Exactly Has 2026 Copied?
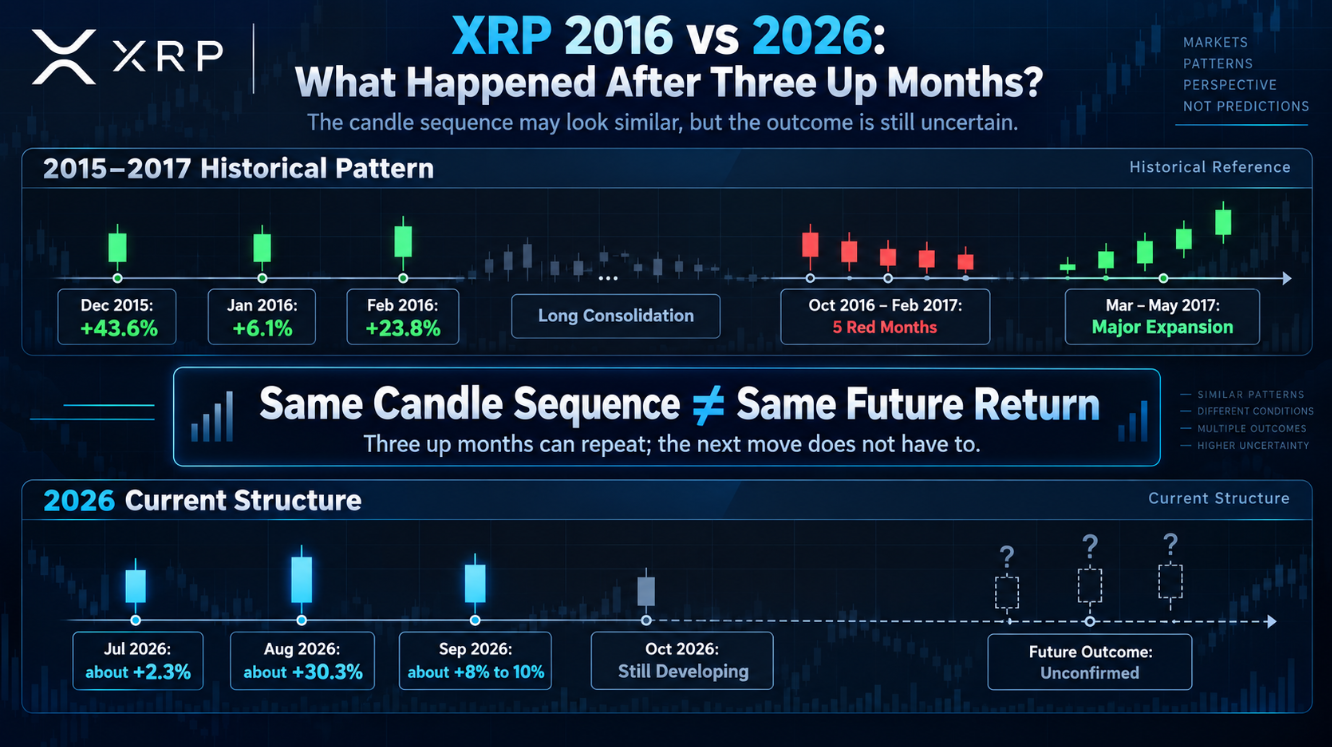
What can currently be confirmed is mainly “three consecutive positive monthly candles.” Different data platforms may show slightly different monthly returns because of UTC cutoffs and open/close data sources, but the direction is broadly the same:
- July 2026: up about 2.3%;
- August 2026: up about 30.3%;
- September 2026: up about 8% to 10%.
So July, August, and September did close higher consecutively. The first observation condition EGRAG raised in September has been completed.
But that only means 2026 has copied one monthly candle sequence. It does not prove that the following things will also be copied:
- How long the subsequent consolidation lasts;
- Whether the drawdown will be similar;
- Whether BTC enters the same cycle;
- Whether XRP can generate an independent move;
- Whether capital inflows can support the same percentage gains;
- Whether the extreme 2017 returns will happen again.
The most accurate judgment is: The first-stage candle characteristics are similar, but the full cycle has not been verified.
6. Why Was the September Close the Key Node in the Original View?
When EGRAG published his view on September 21, July and August had already closed higher, but September had not yet ended. In other words, the 2016 analogy was still missing its third green monthly candle.
After September eventually closed higher, the “third monthly candle condition” proposed in the original view could be considered met. But this is not a confirmation signal of a 2017-style bull market. It merely moves the historical analogy from “two similar months” to “three similar months.”
These two statements must be kept separate:
- The three-month streak was confirmed: fact;
- A 2017-style rally is confirmed: not enough evidence.
Researchers should treat subsequent price action as a new verification process, not stop analyzing after the September close.
7. After Entering October, Why Didn’t EGRAG Simply Declare “$50 Immediately”?
EGRAG’s later analysis emphasized structure rather than requiring every monthly candle to match exactly. He suggested that history may “rhyme” rather than repeat day by day, and that volatility, retests, multiple bottoms, fake breakouts, and long sideways phases could still occur along the way.
A market review on October 5 showed that EGRAG’s historical template even included the five consecutive down months from October 2016 to February 2017. That analysis also listed the 20-month EMA around $1.55 and the 50-week EMA around $1.52 as levels that needed to be reclaimed at the time.
As of October 12, CoinGecko data showed XRP around $1.41, and it was still down over the prior seven days, suggesting the market is still far from “expanding without resistance.”
This also reminds investors: if a pattern allows rallies, declines, and sideways action all to be explained as “still copying history,” it can easily become an unfalsifiable narrative. Effective analysis must provide clear confirmation conditions and invalidation conditions.
8. Where Does the XRP $50 Target Actually Come From?
$50 mainly comes from historical percentage-gain analogies and visual cycle symmetry, not from cash flow, network revenue, or comparable asset valuation.
EGRAG’s original viral expression was “50X? $50?”—in other words, assuming the huge expansion after a past accumulation phase could reappear at a similar order of magnitude, thereby discussing a $50 scenario.
There is an easily overlooked math issue here: as of October 12, 2026, XRP is around $1.41. To go from $1.41 to $50 requires about 35.5x, not 50x. Even based on the reported $1.52 to $1.61 when EGRAG posted, it would require only about 31x to 33x.
So “50X” and “$50” are not the same conclusion produced by strict multiplication from the current price. They are closer to two historical imaginations circulated together: one describes a multiple, the other describes a target price.
This does not mean $50 is absolutely impossible. It means it cannot be packaged as a precise mathematical derivation.
9. Why Is the XRP $23 Target Based on a Different Model?
In a follow-up post in early October, EGRAG proposed a technical target around $23 and explicitly called it a technical projection rather than a guarantee.
That target comes from a long-term Fibonacci 2.236 extension. Fibonacci extensions select historical price swings and then project potential target zones using fixed ratios. They describe price geometry, not corporate earnings or on-chain cash flow.
So the two targets have different sources:
- $50: historical percentage gains, 50x, and cycle symmetry analogies;
- $23: a long-term 2.236 Fibonacci extension.
Both are technical scenarios. Neither should be called XRP’s “fundamental fair value.” For a more complete Bull, Base, and Bear forecasting framework, see XRP price prediction, but any forecast must still face the reality of market cap, supply, and market cycles.
10. Which Is More Credible, $23 or $50?
You cannot assume $23 is necessarily more reliable just because it is lower than $50.
The advantage of $23 is that it has a defined technical level and a reproducible drawing method. Its weakness is that Fibonacci lines themselves cannot explain why the market would necessarily be willing to pay a $1.45 trillion valuation for XRP.
The advantage of 50 is that it easily expresses the enormous potential of historical cycles. Its weaknesses are the extremely small sample, the enormous difference in starting market cap, and the fact that “50x” and “50” are not directly calculated from the current price.
So their reasonable roles are:
- $23: a technical target within a high-intensity Bull Case;
- $50: a historical analogy target within an Extreme Bull Case;
- Neither is a Base Case, and neither is a guaranteed take-profit level.
11. What Market Cap Would XRP Need for $23 or $50?
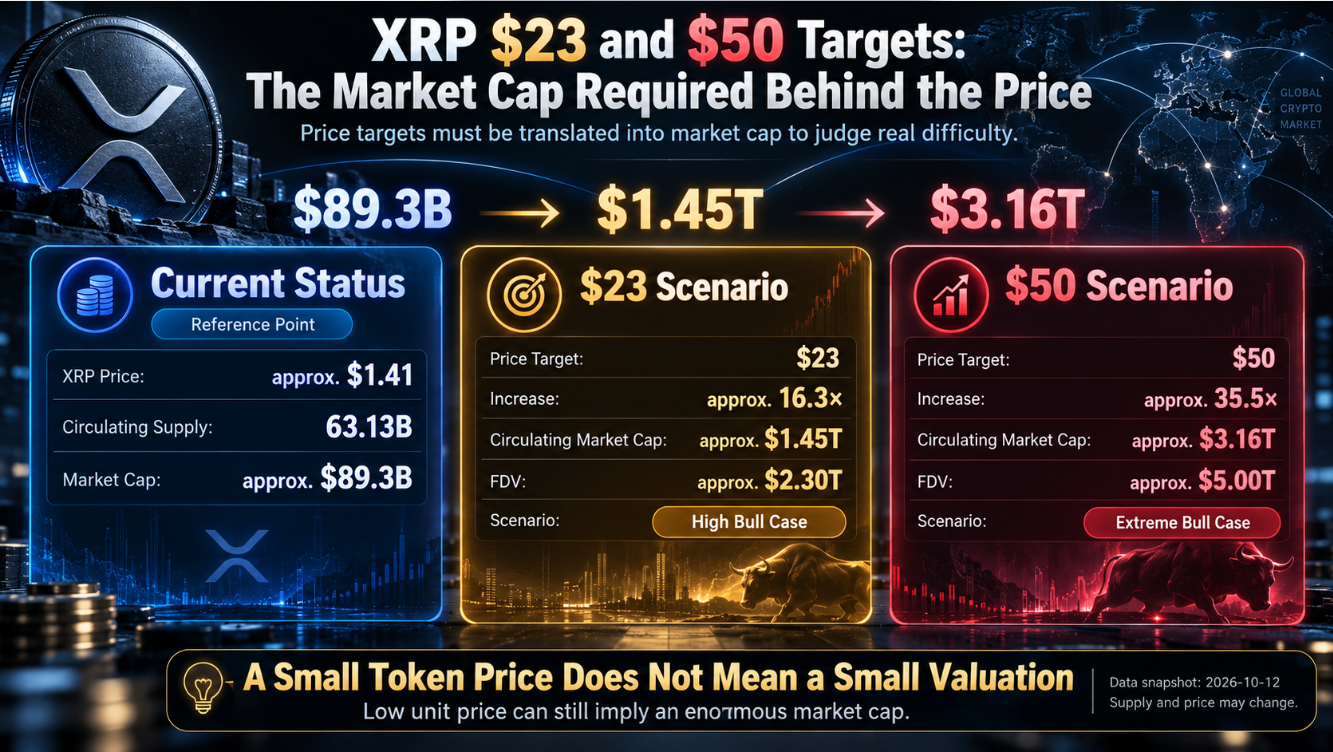
As of October 12, 2026, CoinGecko records XRP’s circulating supply at about 63.13 billion tokens, total supply at about 99.986 billion, and maximum supply at 100 billion.
Based on the current circulating supply, rough calculations are:
- XRP at $23 implies a circulating market cap of about $1.45 trillion;
- XRP at $50 implies a circulating market cap of about $3.16 trillion.
Based on a maximum supply of 100 billion:
- $23 implies an FDV of about $2.3 trillion;
- $50 implies an FDV of about $5 trillion.
This does not yet account for future supply changes, long-term holding ratios, trading depth, or synchronized growth in the total crypto market.
At the same time, XRP’s current market cap is about $89.3 billion. In other words, $23 is not “a little higher.” It would require XRP to grow into a trillion-dollar asset. $50 would mean its circulating market cap could exceed the current total value of the entire crypto market.
Price targets must be translated into required market cap to see the real difficulty.
12. Why Does the 2017 50x Move Not Mean 2026 Can Also Easily Do 50x?
Percentage gains cannot be discussed without starting valuation.
An asset with a $100 million market cap rising 50x requires about $4.9 billion in added valuation. An asset with a $90 billion market cap rising 35x implies trillions of dollars of valuation expansion. “Market cap increase” here does not mean an exactly equal amount of net cash inflow is required, but the market needs sufficiently deep global capital, trading demand, and long-term holding willingness to sustain that price.
There are at least the following fundamental differences between 2016 and 2026:
- XRP’s current circulating supply and market cap are significantly higher;
- Global trading platforms and market-making systems are more mature;
- Institutional products such as perpetual futures, futures, and ETFs have increased significantly;
- Leveraged trading has a larger impact on short-term prices;
- XRP’s regulatory environment is clearer than in 2016;
- Total crypto market cap is larger, but large assets have lower multiple elasticity;
- Market participants already know the 2017 history, so expectations are reflected in prices earlier.
So, similar chart geometry does not mean the same market mechanics.
13. The Biggest Statistical Problem With the 2016 Pattern: A Sample Size Close to 1
EGRAG emphasizes that three green monthly candles inside an accumulation phase are very rare. But “rare” also means there are very few samples available for statistical verification.
If the core sample is only the single set from December 2015 to February 2016, we cannot reliably calculate its win rate, average return, and maximum drawdown over the following year. One historical success story cannot establish a stable probability.
What deserves even more caution is chart pattern overfitting: the analyst already knows the 2017 surge happened, then looks back through prior price action to find three green monthly candles, moving averages, Fibonacci levels, or pattern features. Such backward-looking analysis can easily find “explanations,” but it does not necessarily have forward predictive power.
Therefore, the 2016 Pattern is suitable for generating hypotheses, not for determining position size on its own.
14. Why Are Three Positive Monthly Candles Not Magical by Themselves?
A three-month winning streak only means the close was higher than the open for three consecutive months. It does not automatically show:
- Net spot buying from long-term capital;
- Whale addresses are continuously accumulating;
- XRPL usage is growing rapidly;
- ETFs are consistently seeing net inflows;
- Exchange-available supply is declining;
- Ripple-related business necessarily translates into XRP demand.
To judge whether the three-month streak is higher quality, you need to examine spot volume, derivatives positioning, funding rates, XRP/BTC relative strength, on-chain activity, and institutional product flows.
15. What Are Derivatives Data Signaling?
CoinGecko’s data snapshot as of October 12 showed:
- XRP perpetual futures open interest around $4.2 billion;
- The ratio of perpetual-to-spot 24-hour volume around 14.5x;
- The 8-hour funding rate around 0.0062%.
These data points show that XRP price discovery is already heavily influenced by the derivatives market. In 2016, no equally large global perpetual futures system existed. So the trading structure behind “the same candle” may be completely different.
If the following combination appears, be cautious of a leverage-driven move:
Price rising + OI rising rapidly + overheated funding + spot volume not increasing in tandem.
In that case, price is more vulnerable to long liquidations rather than forming stable 2017-style spot demand.
By contrast, healthier confirmation usually includes rising spot volume, moderate funding rates, non-excessive OI growth, and spot buyers absorbing supply during pullbacks.
16. Why Is XRP/BTC More Valuable Than Looking Only at XRP/USD?
XRP/USD can rise simply because BTC is lifting the entire crypto market. If XRP/BTC keeps falling over the same period, it means XRP is not showing clear independent relative strength.
A more convincing combination is:
- XRP/USD breaks long-term resistance;
- XRP/BTC strengthens at the same time;
- Spot volume expands;
- Lows after retests gradually rise.
This shows that capital is not merely passively following BTC, but actively increasing XRP allocation weight. For verifying what EGRAG calls independent expansion, XRP/BTC is an indicator that cannot be ignored.
17. Why Might BTC Still Determine the Bigger Direction More Than the 2016 Pattern?
XRP remains a high-beta crypto asset. If BTC enters a deep risk-off phase, market liquidity contracts and altcoin valuation multiples decline. Even if XRP’s own monthly structure still looks good, it may continue to draw down.
Investors can use BTC price prediction to judge whether the market is currently in liquidity expansion, a main uptrend, top-range consolidation, or deleveraging.
A reasonable model is not just the XRP pattern, but:
XRP long-term structure × BTC cycle × market liquidity.
18. Why Is ETH the Second Market Confirmation Indicator?
ETH can help assess risk appetite for large-cap altcoins and institutional crypto demand. If BTC remains strong but ETH, XRP, and other large altcoins continue to underperform BTC, it suggests capital is still concentrated in Bitcoin and broad altcoin confirmation is insufficient.
Therefore, ETH price prediction is used here not to prove a direct technical link between ETH and XRP, but to help observe altcoin capital rotation.
A more positive environment usually involves BTC stabilizing, ETH/BTC stopping its decline, large altcoin volume expanding, and capital then rotating further out. If BTC and ETH fall sharply at the same time, XRP’s historical pattern is also more likely to be disrupted.
19. If the 2016 Analogy Is Valid, What 6 Things Should Be Confirmed Next?
1. Monthly Structure
After the three green monthly candles, can XRP hold the long-term breakout area instead of falling back into a multi-year range?
2. Long-Term Support
Can higher lows form during pullbacks, and do key monthly support levels remain valid?
3. XRP/BTC Relative Strength
Can XRP outperform BTC and generate independent capital flow?
4. Spot vs. Derivatives
Is the rally mainly driven by spot demand or by leveraged perpetual futures positioning?
5. Macro Environment
Do BTC, ETH, and global risk assets support altcoin expansion?
6. Valuation Capacity
How much market cap would XRP’s target prices require, and does the overall market have enough liquidity?
These six dimensions can form an “XRP 2016 Pattern Score.” There is no need to produce a seemingly precise total score. Simply mark each item as Bullish, Neutral, or Bearish, and update it as data changes.
20. Under What Conditions Does the 2016 Pattern Remain Valid?
Signals that support the historical analogy continuing include:
- Monthly candles do not fall back below the main long-term breakout area;
- The long-cycle higher-low structure continues;
- Spot volume expands on breakouts;
- XRP/BTC shifts from weak to strong;
- OI and funding rates remain controllable;
- BTC does not enter a long-term bear market;
- XRP’s regulatory, institutional product, and network adoption environment continues to improve.
These conditions do not require XRP to rise every month. Reasonable pullbacks, sideways action, and retests may all be part of the long-term structure. The key is whether the pullback damages the original logic.
21. Under What Conditions Must We Admit the 2016 Pattern Has Failed?
Any historical pattern must be falsifiable. Failure signals to watch include:
- Monthly candles fall back into the main long-term accumulation zone and repeatedly fail to reclaim it;
- The higher-low structure is clearly broken;
- XRP/BTC continues making new cycle lows;
- Spot volume declines over the long term;
- OI and funding rates overheat, followed by large-scale deleveraging;
- BTC enters a long-term bear market;
- XRP regulation, institutional demand, or network adoption materially deteriorates;
- The analyst keeps moving invalidation points so that any decline is explained away as “shaking out weak hands.”
The publicly relayed $23 model did not provide sufficiently clear final deadlines or a unified invalidation price. That is exactly what investors need to supply themselves. A prediction without invalidation cannot be turned into an executable strategy.
22. XRP Future Scenarios: Bull, Base, and Bear
Bull Case: Structure, Capital, and the Broader Market All Confirm
The optimistic scenario requires XRP to hold its long-term structure, XRP/BTC to strengthen clearly, spot demand to improve, institutional products to expand, and BTC to enter a new risk-on phase.
In that case, the market may first discuss recovering the prior all-time high near $3.65, then watch the $6 and $10 zones. Only if market size and capital demand continue expanding would $23 be appropriate to discuss as a high-intensity Bull Case.
Base Case: Three Green Months Are Real, but Long-Term Range Trading Follows
The neutral scenario is that the three-month streak did form, but XRP continues to consolidate repeatedly within a large range rather than immediately copying 2017. In fact, this is closer to 2016 history itself: after the early structure appeared, the market still endured a long wait.
The Base Case should not default to $23 or $50. It should focus on whether XRP can steadily hold long-term support and gradually restore relative strength.
Bear Case: The Three-Month Streak Was Just a Bounce
If BTC weakens, XRP breaks key long-term structure, XRP/BTC keeps falling, spot demand is insufficient, and derivatives undergo large-scale deleveraging, then the three green monthly candles may have been only a bear-market bounce.
At that point, continuing to use “2016 rose a lot later” to explain the decline becomes pattern overfitting.
Extreme Bull Case: $50 Requires a Major Change in Market Structure
$50 corresponds to a circulating market cap of about $3.16 trillion and an FDV of $5 trillion. It requires not only XRP itself to break out, but also enormous expansion in total global crypto market cap, institutional participation, liquidity, and XRP demand structure.
So $50 belongs in the Extreme Bull Scenario, not the Base Case.
23. When to Buy XRP? Don’t Chase Just Because “EGRAG Said $50”
Different entry methods carry different risks.
Breakout Entry
Wait for key resistance to be broken with volume confirmation. The advantage is a clearer trend; the disadvantage is a higher entry cost and the possibility of a fake breakout.
Retest Entry
Wait for a pullback to key areas after a breakout and confirm support. The advantage is clearer stop distance; the disadvantage is that the market may not offer an ideal retest.
DCA
Suitable for spot investors who truly understand XRP’s long-term thesis and can tolerate large drawdowns. DCA does not eliminate fundamental invalidation risk, nor is it suitable for unlimited averaging down.
Event-Driven Entry
Trade around events such as regulation, ETFs, institutional products, or XRPL upgrades. Volatility and expectation gaps before events are large, so position sizing and invalidation conditions are even more important.
Price forecasts can only help determine whether an asset is worth researching. Current market conditions and risk budget determine at what price and with what position size to participate.
24. Using HIBT as an Example: What 7 Things to Check Before Buying XRP?
The following uses HIBT’s XRP trading interface to illustrate a risk-check process. Actual available pairs and product status should be based on the platform page on the day.
1. Confirm XRP/USDT
Verify the asset name and trading pair. Do not accidentally enter another product with the same name or a derivative.
2. Confirm Spot or Perpetual Futures
Buying spot gives exposure to the XRP price. Perpetual futures also include leverage, funding rates, mark price, and liquidation risk. The two cannot be treated as the same thing.
3. Check Current Price and 24-Hour Volume
Do not look first at the $50 target and then ignore where the current price actually is.
4. Check Spread and Order Book Depth
Large orders especially need an assessment of bid-ask spread and estimated slippage.
5. Distinguish Limit Orders From Market Orders
Limit orders can control the highest buy price or lowest sell price. Market orders prioritize execution speed but may create slippage in volatile conditions.
6. For Futures Trading, Check Four Extra Items
These include leverage, funding rate, mark price, and liquidation price.
7. Write Down Invalidation Conditions Before Ordering
Do not treat “$50 has not arrived yet” as a reason never to exit. Before entering, define the maximum acceptable loss, the key structural invalidation level, and the review timeline.
25. Why Can’t Spot and Perpetual Futures Use the Same Long-Term Strategy?
Spot investors, as long as they have not borrowed, can tolerate long sideways periods and drawdowns within their risk budget. Perpetual futures investors must constantly face funding rates, liquidation prices, and short-term volatility.
The 2016 history is precisely a reminder that even if the eventual direction is up, there may still be months of declines in between. Suppose the final target judgment is correct, but XRP first draws down 20% to 40%. The spot position still exists; a high-leverage futures position may already have been liquidated.
Correct Destination ≠ Survive the Path.
Using high leverage to bet on a historical pattern that may take months or longer to play out is a classic mismatch between timeframe and instrument.
26. How Should XRP Position Size Be Determined?
Position size should not be determined by “potential upside multiple.” It should be determined by maximum acceptable loss.
The basic method is:
Acceptable loss amount ÷ decline from entry price to invalidation point = maximum position size
For example, if an account has 10,000 USDT and allows a maximum single-trade loss of 2%, the risk budget is 200 USDT. If the distance from entry to a clear invalidation point is 10%, the theoretical position cap is about 2,000 USDT, and room still needs to be reserved for slippage and execution error.
This is only a risk-management example, not a universal position-sizing recommendation. For trades without a clear invalidation point, the most reasonable position size is usually not larger, but smaller.
27. Why Can’t Technical Analysis Replace XRP Fundamentals?
The EGRAG pattern can at most answer “how price structure might develop.” It cannot answer why XRP should be worth $23 long term.
Long-term investors also need to track:
- XRPL active addresses and real transactions;
- Payments, stablecoins, and RWA activity;
- XRP liquidity use cases;
- Institutional product scale and fund flows;
- The real relationship between Ripple’s business development and XRP demand;
- Regulatory environment;
- Supply releases, escrow, and exchange balances.
If price rises much faster than network usage, spot demand, and institutional capital growth, valuation may be driven mainly by expectations.
28. Why Can’t Different Crypto Assets Use the Same Valuation Framework?
When analyzing What Is PPOLY, the focus is on the SPV, NAV, underlying assets, legal rights, and exit arrangements. When analyzing XRP, the focus is liquidity, network demand, market structure, and cycles.
What Is EMBER/USDT corresponds to a different logic again: Launchpad, platform trading volume, protocol fees, and value capture.
Even though all three assets can be traded with USDT, their sources of value are completely different:
- PPOLY: underlying equity and legal structure;
- EMBER: platform usage, fees, and token value capture;
- XRP: network asset demand, global liquidity, and crypto cycles.
Seeing the same candlestick interface does not mean the same valuation method should be used.
29. EGRAG XRP 2016 Pattern FAQ
What is the EGRAG Crypto XRP 2016 Pattern?
It refers to EGRAG comparing the three positive monthly candles from July to September 2026 with the three-month streak during the December 2015 to February 2016 accumulation phase, and discussing whether history may rhyme again.
Is EGRAG Crypto an official Ripple analyst?
No. EGRAG is a third-party crypto technical analysis commentator. His views do not represent Ripple or XRPL officially.
Is XRP really copying the 2016 chart?
So far, only the feature of three consecutive positive monthly candles has been confirmed. Whether subsequent pullbacks, consolidation, the BTC cycle, relative strength, and capital structure are similar still needs further verification.
Did XRP immediately surge after the 2016 three-month streak?
No. XRP later experienced a long consolidation and fell for five consecutive months from October 2016 to February 2017. The truly powerful expansion did not appear until after March 2017.
Why does EGRAG predict XRP could reach $50?
$50 mainly comes from historical percentage gains and the “50x” cycle analogy, not from cash flow or a network valuation model. Also, from the current price of about $1.41 to $50 is actually about 35x.
How does EGRAG calculate the XRP $23 target?
$23 comes from a long-term 2.236 Fibonacci extension. It is a price geometry projection, not fundamental fair value.
How much market cap would XRP need to reach $23?
Based on a circulating supply of about 63.13 billion, $23 implies a circulating market cap of about $1.45 trillion. Based on a maximum supply of 100 billion, the FDV would be about $2.3 trillion.
How much market cap would XRP need to reach $50?
Based on the current circulating supply, about $3.16 trillion. Based on maximum supply, the FDV would be about $5 trillion.
Do three positive monthly candles mean XRP will definitely keep rising?
No. A three-month streak is only a historical price feature. It must be judged alongside spot volume, XRP/BTC, derivatives leverage, the BTC cycle, and fundamentals.
What would invalidate the XRP 2016 Pattern?
Monthly candles breaking below long-term structure, XRP/BTC continuing to make new lows, weakening spot demand, leveraged deleveraging, BTC entering a long-term bear market, or deteriorating XRP fundamentals could all invalidate the historical analogy.
Should I buy XRP because EGRAG predicted $50?
You should not open a position based only on a single analyst’s target. First assess the current price, required market cap, invalidation conditions, position size, and your own risk tolerance.
Is spot better than perpetual futures for waiting on a long-term pattern?
Spot has no liquidation or funding-rate risk and can better withstand long consolidation. Perpetual futures may be liquidated during short-term drawdowns before the long-term thesis plays out. But spot also carries the risk of large price declines.
30. Conclusion: 2026 Copied Three Monthly Candles, but Not the 2017 Outcome
EGRAG Crypto’s observation about the XRP 2016 Pattern is not completely unfounded. July, August, and September 2026 did close higher consecutively, and similar three green monthly candles appeared during XRP’s early long-term accumulation phase.
But what history actually tells investors is not “three green months, then immediate 50x.” After the 2016 sequence appeared, XRP still went through a long consolidation and multiple months of declines. The real large-scale price expansion did not arrive until 2017.
$23 and $50 must also be understood separately: $23 comes from a 2.236 Fibonacci extension, while $50 mainly comes from historical percentage gains and cycle symmetry analogies. Both are technical scenarios, not fundamental fair value, and certainly not official targets from Ripple.
Real-world constraints matter even more. XRP currently has a circulating supply of about 63.13 billion tokens and a market cap of about $89.3 billion. $23 implies a circulating market cap of about $1.45 trillion, while $50 implies about $3.16 trillion. That is completely different from starting from a tiny market cap in 2016.
Therefore, the most important judgment in this article is:
XRP’s 2026 chart similarity is clearly higher than its market-structure similarity.
The truly valuable strategy is not betting that history will repeat candle by candle, but continuously verifying whether monthly structure, XRP/BTC, spot demand, derivatives leverage, the BTC cycle, and fundamentals all support upside—and knowing when to exit if those conditions fail.
History can rhyme, but it will not take on position risk for investors.